
Abstract
We measured the core and memory temperatures of a GeForce RTX 5090 at constant power as a function of the GPU fan speed and the case fan speed. Intake air stayed between 18.7 and 19.4 °C. The case had three 120 mm intake fans at the front, blowing across the motherboard and the graphics card about 3 to 5 mm from its edge, and one rear exhaust fan; the top was open. The small 92 mm fan by the power supply was left on its own setting and not counted.
The measurements took about 5.6 hours: a 41-minute pilot, a 98-minute fan grid and a 3.25-hour power-limit run. After a fan change the temperature settles exponentially with a time constant of about 50 s. After 20 s only a third of the change has happened; a plain reading is reliable only after about 3τ, some 2.5 minutes.
A normal cell therefore took 70 s: 10 s discarded after the change, 60 s logged, and a first-order fit to find the settled value. For the hot spot this matched the settled value within 0.5 °C on average; the core and memory, read in whole degrees, still need cells run to steady state.
Status. First results from one GeForce RTX 5090 at 575 W, in a case with an open top, are in, together with the power-limit run. The quietest-settings table, the closed case and two cards follow.
Key findings
- The card’s own fans dominate. Each 1000 rpm more on the GPU fans lowered the core by 7.6 °C and the memory by 7.3 °C; the case fans by 0.66 and 0.71 °C (575 W, top open; 60-second means, likely underestimates). Core and memory
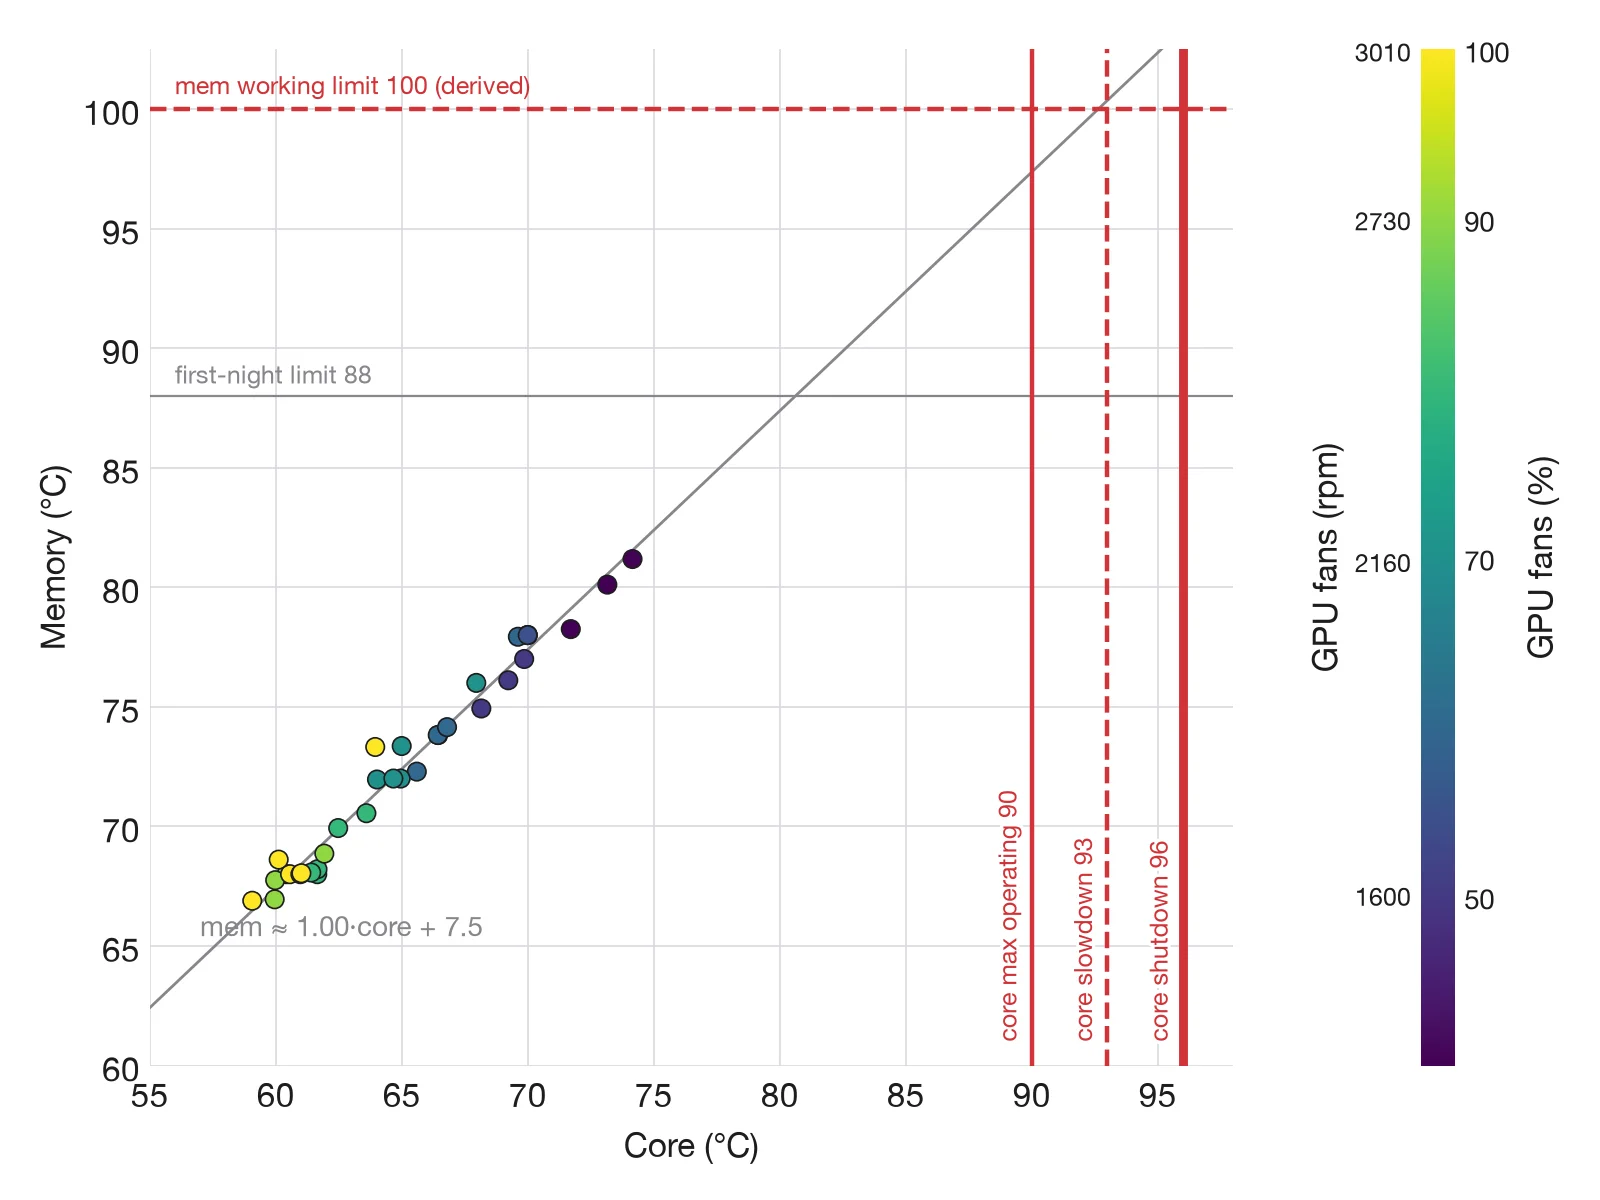
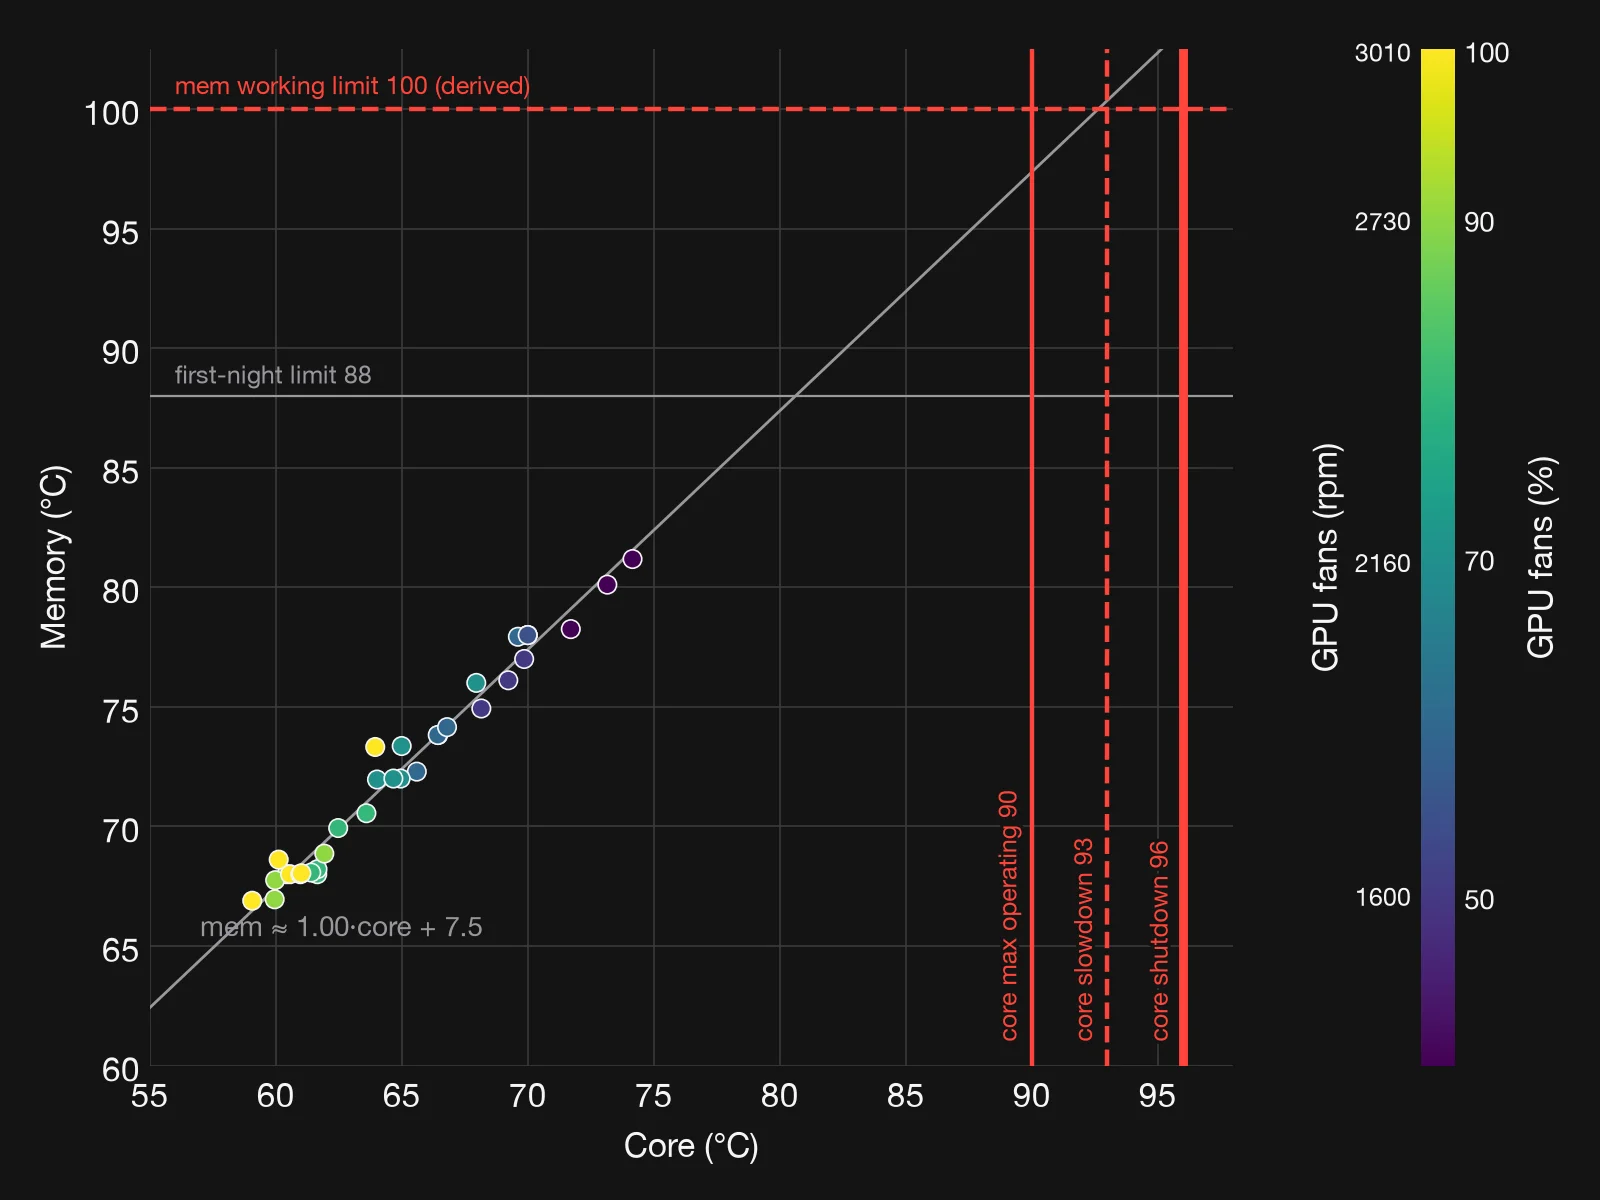
- The core is the binding limit. The memory runs 6.4 to 8.5 °C above the core (9.4 °C in the first, still-warming cell), so with our 100 °C memory limit the core reaches its 90 °C maximum first, in every cell. Memory temperature
- Power limit. At fixed fans, each 100 W less lowered the hot spot by about 8 to 13 °C. The slopes are approximate until a steady-state rerun. The card accepts no limit below 400 W, 70 % of stock. Power limit
- Readings need time. The median hot-spot time constant is 50 s: a reading 10 to 20 s after a fan change shows only 18 to 33 % of the change. A 60-second fit matched the settled hot spot within 0.5 °C on average; core and memory need settled cells. Settling
- Limits. RTX 5090 core: maximum operating 90 °C, slowdown 93 °C, shutdown 96 °C. Memory: no official GDDR7 limit is published; we use a derived working limit of 100 °C junction temperature. Table by generation
- Repeatable within a run. The reference cell held within 0.3 °C over a night; between runs, fast cells differed by up to 4 °C. All runs took about 5.6 hours and about 2.75 kWh for the card.
The problem
A GeForce RTX 5090 is rated at 575 W of total graphics power [1]. In a workstation that heat leaves through two sets of fans: the card’s own and the case fans. More airflow lowers temperatures and raises noise.
Most systems settle this trade-off with fan curves chosen by feel; we measure it instead. We look for the pair of fan speeds that holds a target temperature with the least noise. We also look for the highest power the card can draw within a noise budget.
The answers differ between an open and a closed case, so we measure both.
What we measure
Two inputs are set by the test, one condition is measured but not controlled, and the rest are the card’s response.
| Symbol | Quantity | Role |
|---|---|---|
| GPU fan speed, rpm | input, set by the test | |
| case fan speed, rpm | input, set by the test | |
| intake air temperature, measured in the bottom chamber of the case, °C | disturbance, measured | |
| GPU core temperature, °C | output | |
| memory temperature, °C | output | |
| hot-spot temperature, °C | output | |
| board power, W | held steady by the load | |
| sound pressure level at the operator position, dB(A) | output |
Fan speeds are set as duty cycles, but the model uses the measured rpm. The relation between duty and rpm is not linear and differs from fan to fan.
The GeForce RTX 50 series does not report a hot-spot temperature through the public driver interface. We read it from the GPU’s on-die thermal registers.
Temperature limits
NVIDIA lists a maximum GPU temperature of 90 °C for the GeForce RTX 5090 [T1]. In the driver this is the maximum operating temperature, where clocks start to fall [T9]. The driver of our card also reports a slowdown threshold of 93 °C and a shutdown threshold of 96 °C.
The 90 °C figure is not new: the RTX 4090 is listed at 90 °C too [T2]. The drivers also report a lower target temperature for fan control, 83 °C on the RTX 3090 and 3090 Ti [T6]; it is not the maximum.
For the memory NVIDIA publishes no limit, and Samsung gives no temperature range for the GDDR7 part used on the RTX 5090 [T13]. A distributor lists the part at 0 to 95 °C operating, without saying whether this is case or junction temperature [T19]. On the Founders Edition all 16 GDDR7 packages sit on the front of the board, around the GPU and under the main cooler [T14][T15]. In our measurements the case fans change the memory temperature far less than the card’s own fans (Figure 5). What the memory reading is, and the limit we use.
We work to two limits: the core never above 90 °C, and the memory junction at most 100 °C, a working limit we derive below. The first night used a stricter memory limit of 88 °C. During a test the core stops earlier, 5 °C below the slowdown threshold.
| Card | Generation | Max operating (core) | Slowdown / shutdown | Memory | Memory limit |
|---|---|---|---|---|---|
| GeForce RTX 2080 Ti | Turing | 89 °C [T4] | 91 °C* [T7] / 94 °C* [T7] | GDDR6 | Tc 0–95 °C [T10]; Tj not published |
| GeForce RTX 3090 | Ampere | 93 °C [T3] | 95 °C* [T6] / 98 °C* [T6] | GDDR6X | about 110 °C Tj, reported [T12] |
| GeForce RTX 3090 Ti | Ampere | 92 °C [T3] | 94 °C* [T6] / 97 °C* [T6] | GDDR6X | about 110 °C Tj, reported [T12] |
| GeForce RTX 4090 | Ada Lovelace | 90 °C [T2] | not published | GDDR6X | Tc 0–95 °C [T11]; about 110 °C Tj, reported [T12] |
| GeForce RTX 5090 | Blackwell | 90 °C [T1] | 93 / 96 °C, our card | GDDR7 | not published [T13]; 95 °C listed by a distributor, case or junction not stated [T19]; we use 100 °C junction, derived |
| RTX A6000 | Ampere | not published; 93 °C* [T8] | 95 °C* [T8] / 98 °C* [T8] | GDDR6 ECC [T16] | not published |
| RTX 6000 Ada | Ada Lovelace | not published [T17] | not published | GDDR6 ECC [T17] | not published |
| RTX PRO 6000 Blackwell | Blackwell | not published [T18] | not published | GDDR7 ECC [T18] | not published |
Max operating: NVIDIA’s published maximum GPU temperature. Slowdown and shutdown are not published by NVIDIA; values marked * come from driver reports of single cards. Tc: case temperature; Tj: junction temperature.
- T1. NVIDIA. GeForce RTX 5090 specifications. nvidia.com
- T2. NVIDIA. GeForce RTX 4090 specifications. nvidia.com
- T3. NVIDIA. GeForce RTX 3090 and 3090 Ti specifications. nvidia.com
- T4. NVIDIA. GeForce RTX 20 series comparison. nvidia.com
- T5. NVIDIA. GeForce RTX 50 series comparison. nvidia.com
- T6. NVIDIA Developer Forums. Driver report for the RTX 3090 and 3090 Ti, single cards. forums.developer.nvidia.com
- T7. NVIDIA Developer Forums. Driver report for the RTX 2080 Ti, single card. forums.developer.nvidia.com
- T8. NVIDIA Developer Forums. Driver report for an RTX A6000, quoted for comparison in a thread on the RTX 6000 Ada. forums.developer.nvidia.com
- T9. NVIDIA. System Management Interface documentation: definitions of the temperature thresholds. docs.nvidia.com
- T10. Micron MT61K256M32JE-14:A, GDDR6 8 Gb, case temperature 0–95 °C (distributor listing). digikey.com
- T11. Micron MT61K512M32KPA-21:U, GDDR6X 16 Gb, case temperature 0–95 °C (distributor listing). digikey.com
- T12. Igor’s Lab. RTX 3090 Founders Edition water block test: GDDR6X junction limit of 110 °C (secondary source). igorslab.de
- T13. Samsung Semiconductor. K4VAF325ZC-SC28 GDDR7: no temperature range given. semiconductor.samsung.com
- T14. PCGamesN. The GeForce RTX 5090 board: all GDDR7 on the front, around the GPU. pcgamesn.com
- T15. Igor’s Lab. GeForce RTX 50 GDDR7 temperature zones: 16 memory packages on the RTX 5090. igorslab.de
- T16. NVIDIA. RTX A6000 specifications. nvidia.com
- T17. NVIDIA. RTX 6000 Ada Generation specifications. nvidia.com
- T18. NVIDIA. RTX PRO 6000 Blackwell specifications. nvidia.com
- T19. Fusion Worldwide. Catalogue entry for the Samsung K4VAF325ZC-SC28: maximum operating temperature 95 °C, case or junction not stated; retrieved 21 October 2026. fusionww.com
- T20. PC Games Hardware, 1 February 2021: the memory junction reading is the highest of all memory temperatures inside the silicon, and throttling starts at about 110 °C on GDDR6X (statements by the developer of a monitoring tool). pcgameshardware.de
- T21. Guru3D. Samsung is the primary supplier of GDDR7 memory for GeForce RTX 50 GPUs. guru3d.com
- T22. Alktech. Review of the MSI GeForce RTX 5090 32G Suprim Liquid SOC: memory junction 68–74 °C in a 4K benchmark, about 546 W, about 28 °C room air. alktech.co
- T23. Igor’s Lab, 21 July 2026. RTX 50 modders unlock per-module temperatures for GDDR7: eight readings on the RTX 5090, apparently for paired packages. igorslab.de
What the memory temperature is, and which limit we use
The memory reading is the memory junction temperature: one value per card, reported by the driver. Monitoring tools show it as the memory junction temperature; their developer describes it as the highest of all memory temperatures inside the silicon, not a surface or average value [T20]. NVIDIA does not document how the value is formed.
Over 33 of the 34 grid cells the memory sat 6.4 to 8.5 °C above the core, 7.3 °C on average. The remaining cell, the first of the night with every fan at 100 %, read 9.4 °C while the card was still warming up. Core and memory moved together, with a correlation of 0.988, and the gap showed no consistent trend with either set of fans. Part of its scatter of about ±1 °C comes from the memory reading, which is often in whole degrees.
Neither NVIDIA nor Samsung, the main GDDR7 supplier for the RTX 50 series [T21], publishes a junction limit for GDDR7. Higher figures quoted online cite no datasheet. The 95 °C distributor figure [T19] does not say whether it is a case or a junction temperature, and a case limit is not directly comparable with a junction reading. For comparison, GDDR6X on RTX 30 cards throttles at about 110 °C junction, according to the developer of a widely used monitoring tool; Micron and NVIDIA do not publish it in public documents [T12][T20].
We therefore use a derived working limit of 100 °C memory junction temperature. It is our own limit, not a manufacturer rating. The core limit is 90 °C and the memory runs at most about 8.5 °C above the core, so at a core of 90 °C the memory reads about 98.5 °C. A 100 °C memory limit therefore never acts before the core does: the core’s 90 °C is the binding limit. The gap was measured at 575 W with this load and an open top; if a later run, for example in the closed case, shows a larger gap, the memory limit may bind first, and we will say so.
The first night ran with a stricter memory limit of 88 °C. Together with the hot-spot limit, it is why cells with GPU fans at 40 to 50 % and the two slowest case speeds are missing.
Others report similar values. A review of a liquid-cooled MSI RTX 5090 measured a memory junction temperature of 68 to 74 °C in a 4K game benchmark at about 546 W and 28 °C room air [T22]; our cells, at a constant 575 W and 19 °C intake, read 67 to 81 °C. Modders have also unlocked more detailed memory readings on RTX 50 cards: eight on the RTX 5090, apparently one per pair of packages [T15][T23]. We may read these with our own code in a later run.
One number per setting
Temperatures depend on the room and on power, and both change from run to run. Dividing the temperature rise by the power removes both:
is the thermal resistance from the GPU core to the intake air. It plays the same role as the junction-to-ambient resistance in JEDEC thermal guidelines [4, 5]. Lower means better cooling.
The same ratio is formed for the memory, , and for the hot spot. Once is known for a fan setting, the core temperature at any power and room temperature follows:
is the power of the whole board, not of the core alone. The share that heats the core sensor depends on the workload. Every run therefore uses the same load, and holds for that load.
Equation (1) assumes the rise is proportional to power. Natural convection and the warming of the air make it only close to proportional. The power-limit run, described below, checks this.
The measurement grid
We measure on a full grid: every GPU fan level combined with every case fan level. A full grid shows how the two sets of fans interact, which testing one fan at a time misses [6].
The main grid has eight GPU fan levels, 30 to 100 % in steps of 10. The case fans have five: the lowest speed that still spins, full speed, and 25, 50 and 75 % of the way between. On the first night these were 15, 36, 58, 79 and 100 %.
A reference cell, GPU fans at 55 % and case fans at 72 %, is measured at the start, middle and end of the run.
A coarse pilot on a four-by-four grid came first, every cell run to full steady state. It found the lowest case fan speed that still spins and measured settling times of 150 to 350 seconds, which led to the faster 60-second cells. The pilot used an arithmetic-only load, so it is not part of the model.
Each row runs at a fixed case fan speed, from GPU fans at 100 % down to the slowest safe level. The hottest cells of a row come last, so the row can stop there without losing the rest.
Between rows the GPU fans return to 100 % and the case fans step down by 5 %. Within a row, a 5-point step sits between cells. These bridge steps last 30 seconds, 20 of them logged, and are not used in the fit. The plan foresaw a serpentine order; the first night ran row by row.
Settling and extrapolation
After each step the first 10 seconds are skipped and the next 60 seconds are logged. A first-order response is fitted to each temperature:
The fit gives the settled temperature , the time constant and a 95 % confidence interval for . A cell then takes 70 seconds instead of several minutes.
Checking the extrapolation
Every fourth cell, and the reference cell, also runs to full steady state. It is accepted when every temperature satisfies
The slope is fitted over the last two minutes, first evaluated 150 seconds after the step. The value is the mean over the final 60 seconds. With a time constant of a few minutes, the rise still to come is about , under 1 °C.
The difference between and the settled value is the extrapolation error, reported with the results.
Safety limits
Each temperature has a limit. The core limit is 5 °C below the driver’s slowdown threshold; memory 88 °C on the first night and the hot spot 95 °C.
A cell is skipped before it runs when its predicted settled value comes within 5 °C of a limit. The slower cells left in that row are skipped too. If a reading still reaches its limit, all fans go to 100 % and the cell is flagged. The fans are never stopped during the test.
Repeats and drift
The order is not random, so a slow drift would line up with fan speed. Taking the rise above the intake temperature removes room drift. The reference cell, measured at the start, middle and end, shows what drift and hysteresis remain.
Test set-up
The first run uses a WS.COMPUTER workstation with one GeForce RTX 5090. The top of the case is open in this run. The card stays at its default 575 W power limit.
The load is our own program. It keeps the arithmetic units and the memory busy at a constant rate, so is steady at every point of the test. All readings are logged once per second. The three fans of the CPU liquid cooler’s radiator, at the bottom of the case, stayed on their own curve and were logged. The pilot took 41 minutes, the main fan grid 98 minutes and the power-limit run 195 minutes: about 5.6 hours in all. The card used about 2.75 kWh: 0.37, 0.88 and about 1.5 kWh. The whole computer was not metered.
The full grid is run with the case open, as in the first run, and again with every panel fitted. In an open case the case fans are expected to matter less; the two grids measure how much.
Noise is measured with a sound level meter at a fixed operator position, following the set-up principles of ISO 7779 [2]. The meter and its position are listed with the results.
Uncertainty
Each value of carries the uncertainty of its sensors and, for extrapolated cells, of the fit. The core temperature is reported in whole degrees, and board power readings are accurate to a few per cent. Propagating both gives [13]
where , and includes the intake sensor and the confidence interval of . We report with every cell.
The power error is common to all cells. It scales every alike and does not change the order of the settings or the shape of the frontier. The power limit is set through the same reading, so the error largely cancels in . When the core reading does not change, averaging cannot remove the rounding, so a standard uncertainty of about 0.3 °C, 1/√12 of a degree, remains.
A model of the cooler
A model lets us interpolate between grid points and check that the data make physical sense.
The heat sink passes heat to the air by forced convection. For turbulent flow in a pipe, the Dittus–Boelter correlation, in the form given by McAdams, links the Nusselt number to the Reynolds number [7–9]:
The heat transfer coefficient is proportional to , and to the air speed. By the fan laws, airflow through a fixed system is proportional to fan speed [3]. So the heat transfer coefficient grows roughly as .
This suggests the following form for the conductance :
, in W/°C, is the intercept: what the fit leaves at zero fan speed, an extrapolation rather than a measurement. , and are fitted coefficients, in W/°C per rpm0.8 (per rpm1.6 for ). measures how much each set of fans changes the effect of the other; its sign comes from the data.
Equation (7) is an empirical form, not a derivation. Both sets of fans change the air speed through the same fins, and the case fans also cool the air the card draws in. The coefficients are therefore not separate conductances.
What we do not assume
The exponent 0.8 is a starting point. Equation (6) holds for fully developed turbulent flow, at Reynolds numbers above about 10 000. Air between heat-sink fins is often laminar.
For laminar flow developing along a fin, as on a flat plate, the exponent is 0.5 [10]. We therefore also fit the exponent as a free parameter and report it.
The air also warms as it crosses the fins. This adds a resistance that falls roughly as 1/rpm; the free exponent absorbs part of it.
Thermal paste and the vapour chamber add a resistance between the die and the fins that airflow does not change. If the residuals of (7) curve at high fan speeds, we fit
Both models are fitted by nonlinear least squares, with residuals taken on the core temperature in °C [11]. We choose between them by leave-one-out cross-validation [12]. The coefficients are reported with confidence intervals, and the residual of every cell is published.
First results
The first night, 20 to 21 October 2026, ran the fan grid on one GeForce RTX 5090 at a constant 575 W. The case had its top panel removed.
The load held 48.5 TFLOPS of FP32 arithmetic and 1.52 TB/s of memory traffic over 22 GiB, about 70 % of the card’s memory. Intake air stayed between 18.7 and 19.4 °C and drifted by −0.03 °C per hour; 341 sensors were logged once per second.
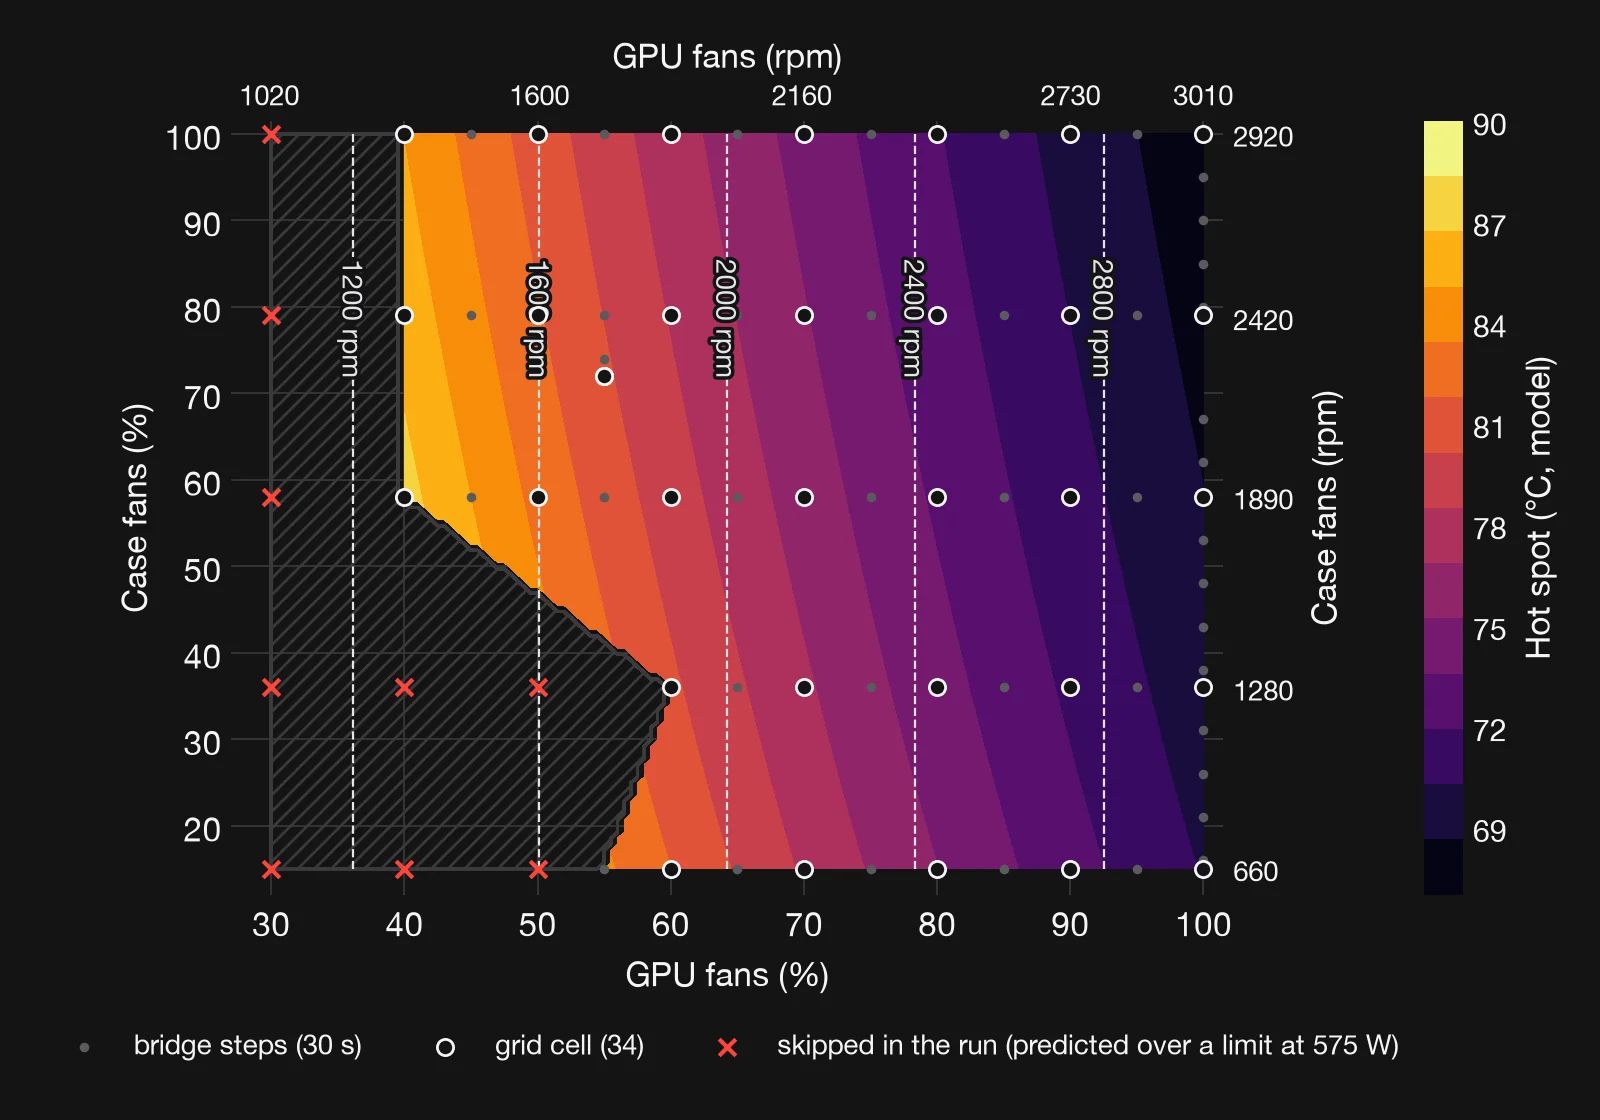
The grid cells lay at GPU fans of 40 to 100 % in steps of 10. Predicted to come within 5 °C of a limit, GPU fans at 30 % were skipped at every case speed. So were 40 and 50 % with the two slowest case speeds. The rule is conservative: in the power-limit run, GPU fans at 50 % with case fans at 15 % held 85.5 °C at 575 W.
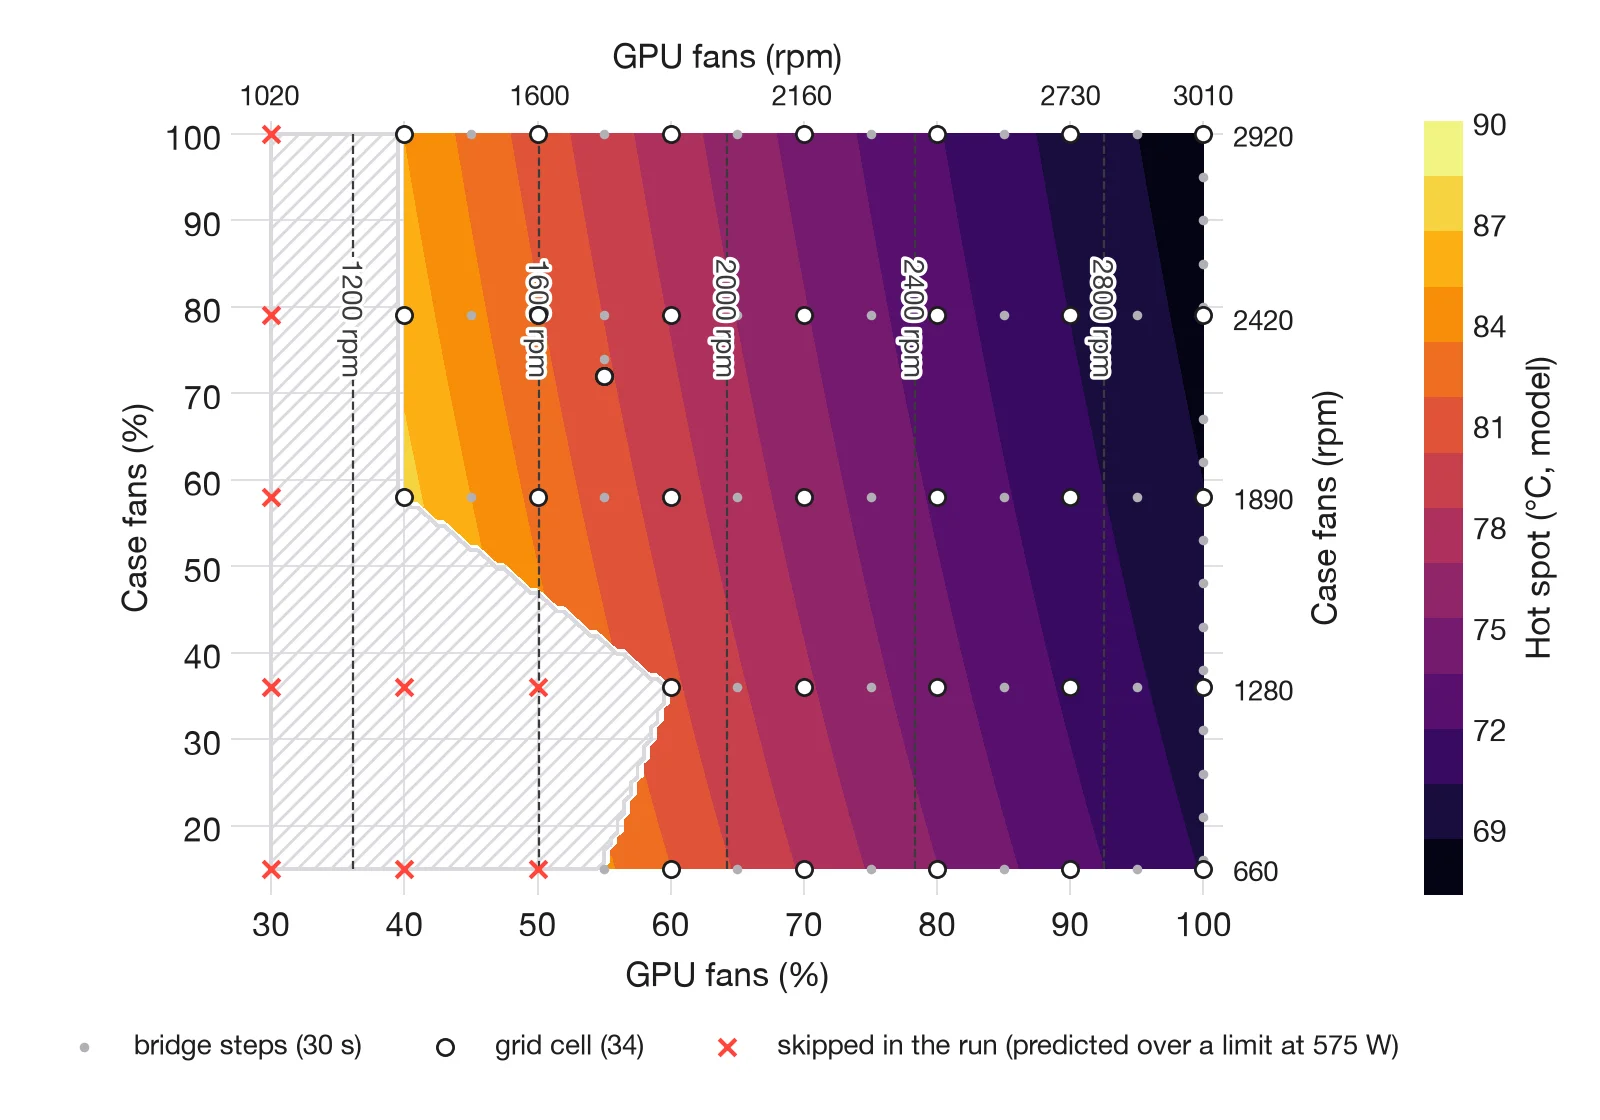
The card’s own fans dominate
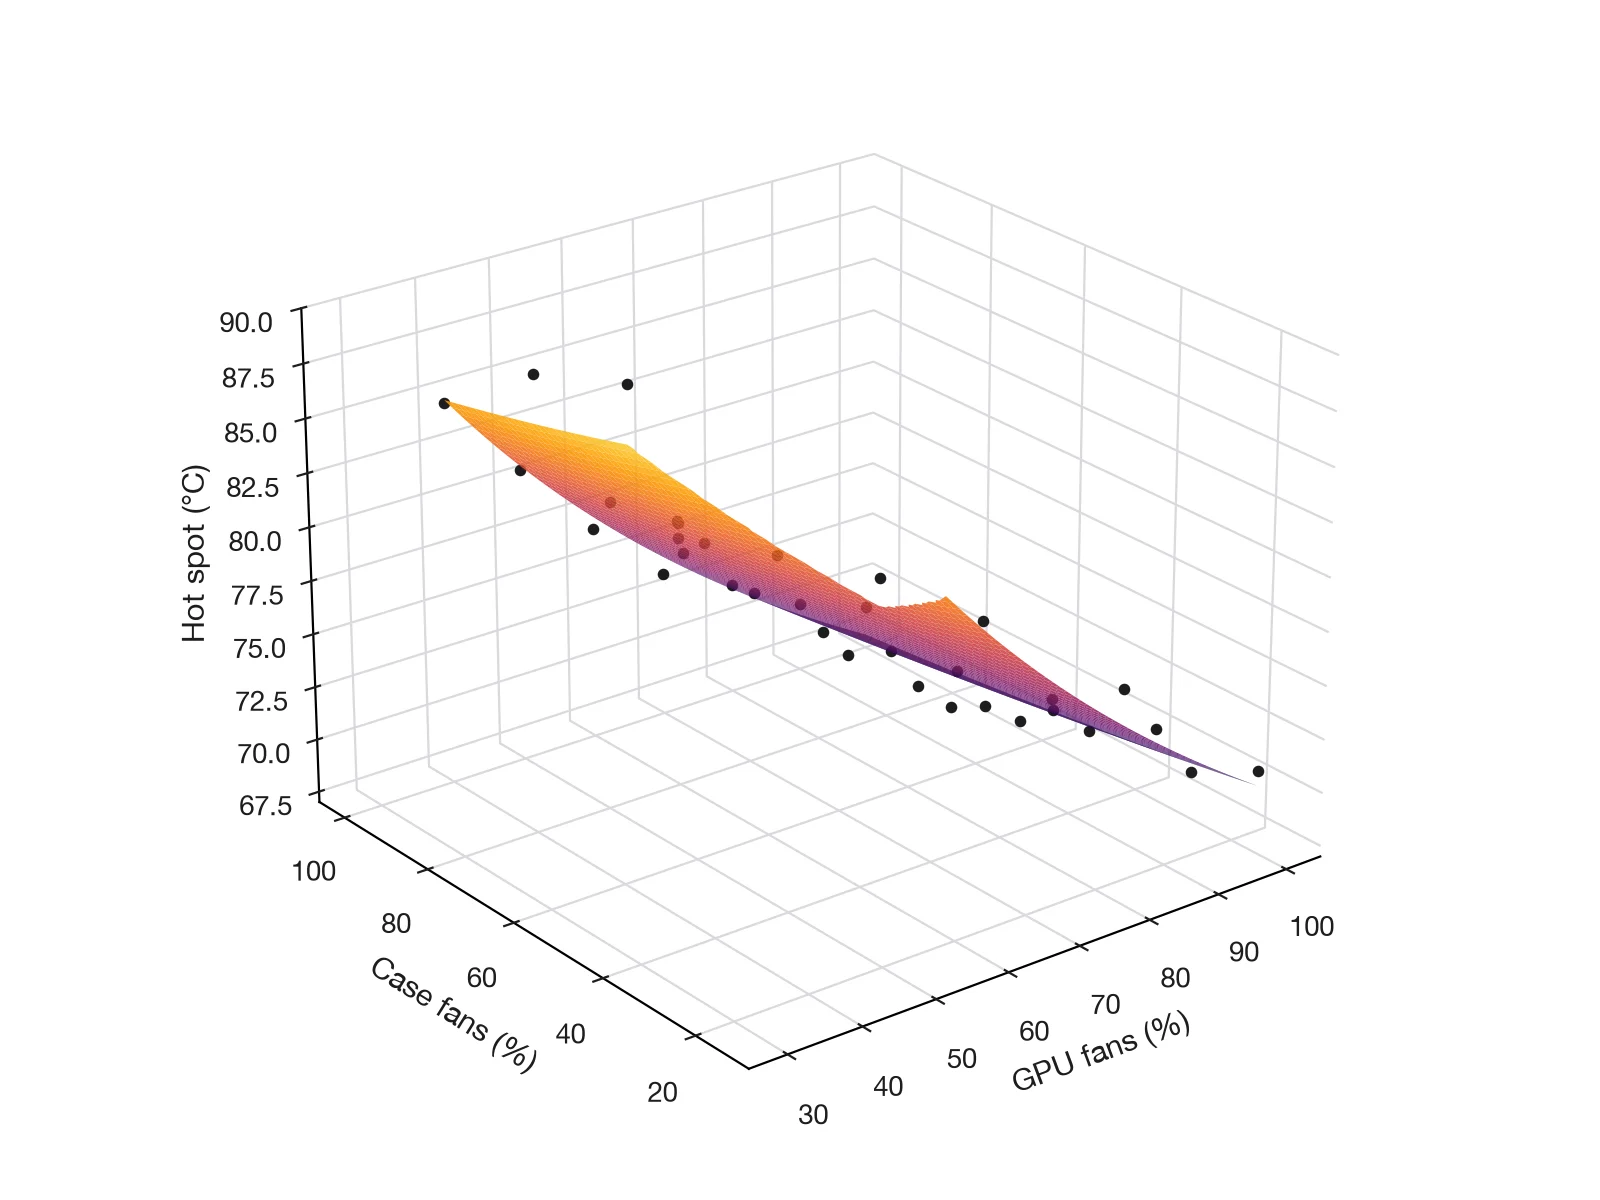
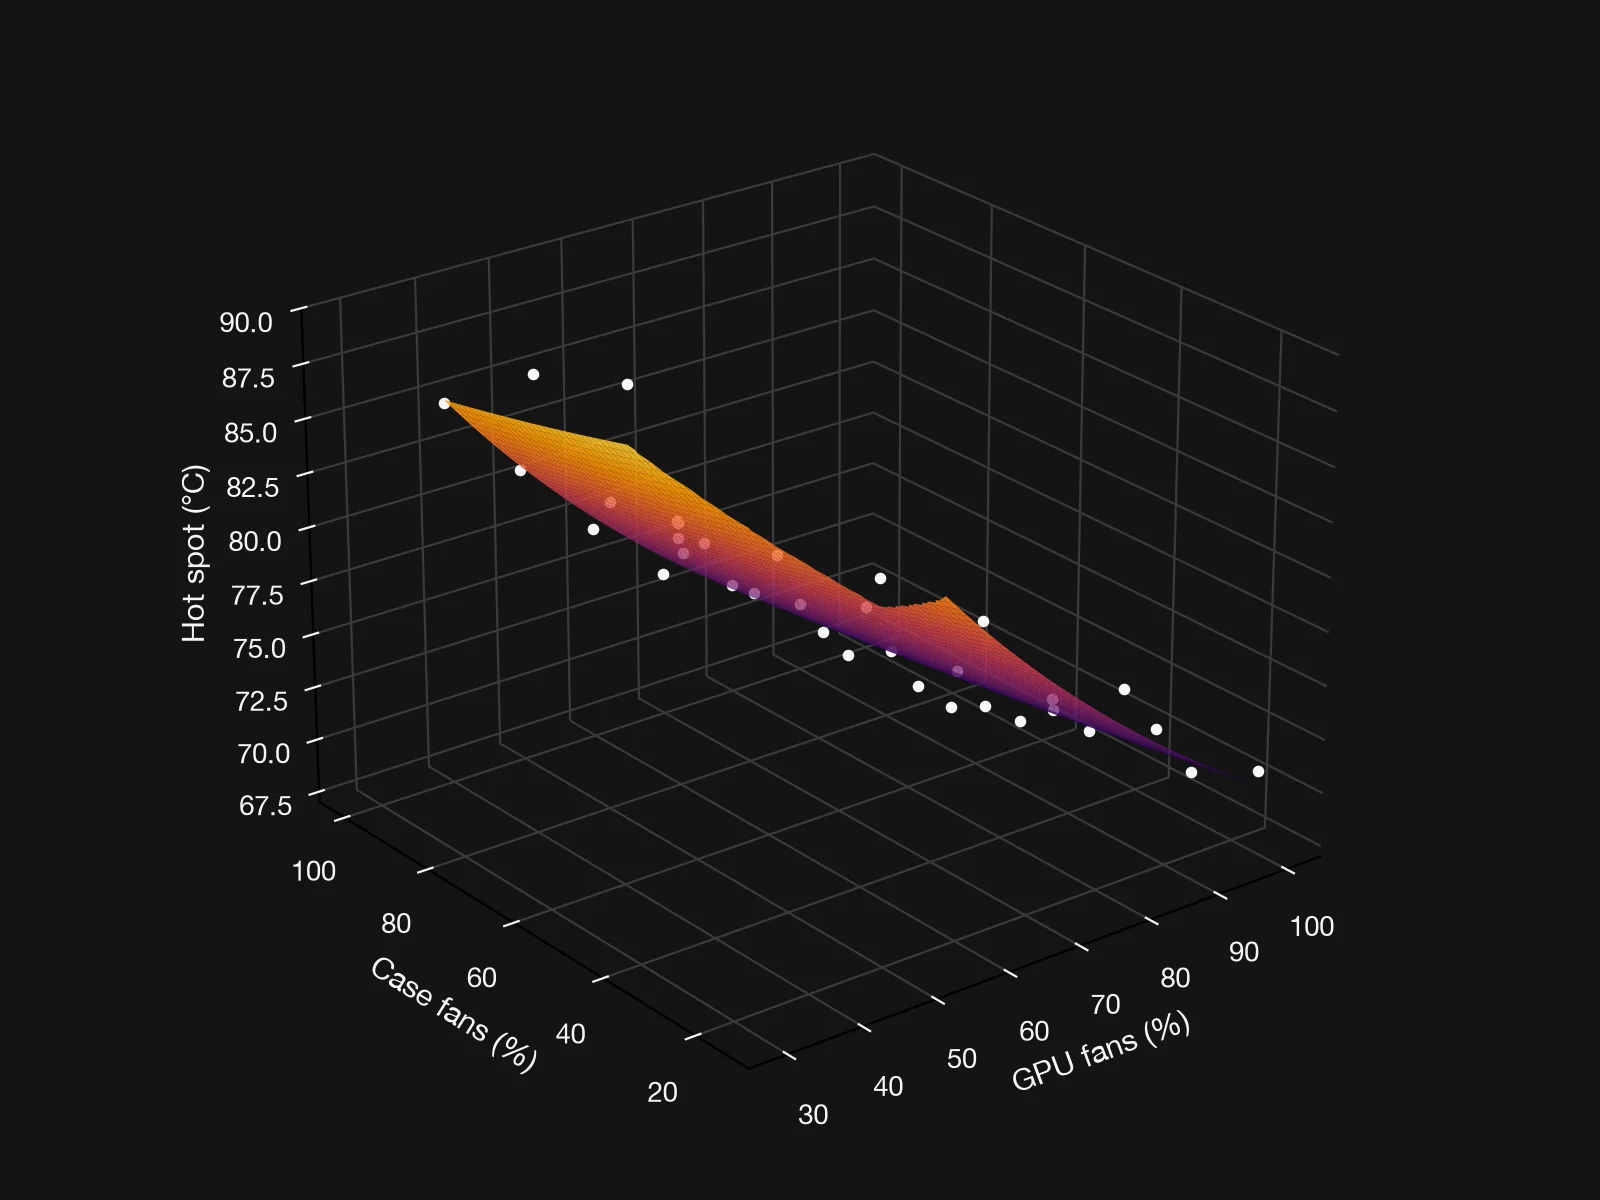
The fitted settled hot spot ranged from 68 °C, GPU fans at 100 %, to 90 °C with the GPU fans at 40 %. Turning the GPU fans down from 100 to 40 % raised it by 16 to 21 °C, depending on the case speed.
Two cells at 70 % GPU fans ran to full steady state. Turning the case fans down from 100 to 15 % raised the hot spot by 3.6 °C. With the top open, the card’s own fans change the hot spot several times as much as the case fans.
With the exponent fixed at 0.8, model (7) is linear in its coefficients. This first fit is ordinary least squares on , with fan speeds in rpm; the RMSE is on temperature. It uses 34 measurements: 31 grid cells and the reference cell three times.
| Sensor | , W/°C | of | RMSE, °C | |||
|---|---|---|---|---|---|---|
| hot spot | 4.26 | 0.0111 | 0.00195 | 5.7 | 0.966 | 1.1 |
| core* | 5.98 | 0.0126 | 0.00100 | 12.6 | 0.928 | 1.3 |
| memory* | 4.22 | 0.0127 | 0.00422 | 3.0 | 0.756 | 2.3 |
* Provisional. In 13 and 20 of the 34 cells the fit for the core and the memory failed, and the 60-second mean was used. Both rows will be refitted on steady-state cells.
The ratio is per rpm0.8. Over their measured ranges, the GPU fans change the conductance about 4 times as much as the case fans for the hot spot. For the core it is 9 times. For the memory the provisional fit gives twice, while the 60-second means give about 8 times (see ‘Core and memory’).
The interaction term is under 5 % of the GPU fan term for the hot spot and the core. For the memory it is about a quarter, with a negative sign.
is the intercept of a fit that starts at 1300 rpm, not a measured conductance without airflow. The nonlinear fit with residuals in °C, the free exponent and model (8) follow with the full analysis.
Core and memory
Core and memory are the primary limits; the hot spot is reported alongside them. Over the 34 grid cells the two move together, with a correlation of 0.988. The memory runs 6.4 to 9.4 °C above the core, 7.4 °C on average.
Each 1000 rpm more on the GPU fans lowered the core by 7.6 °C and the memory by 7.3 °C. Each 1000 rpm more on the case fans lowered them by 0.66 and 0.71 °C. These are 60-second means at 575 W with the top open; at low fan speeds such means read low, so the slopes are likely underestimates.
With our 100 °C memory limit, the core had 0.6 to 3.6 °C less headroom than the memory in every cell, 2.6 °C on average, so the core binds first. Extending the fitted line, the memory would reach 100 °C only with the core near 92.6 °C. The highest memory reading so far was 81 °C, so this is a long extrapolation.
Clocks
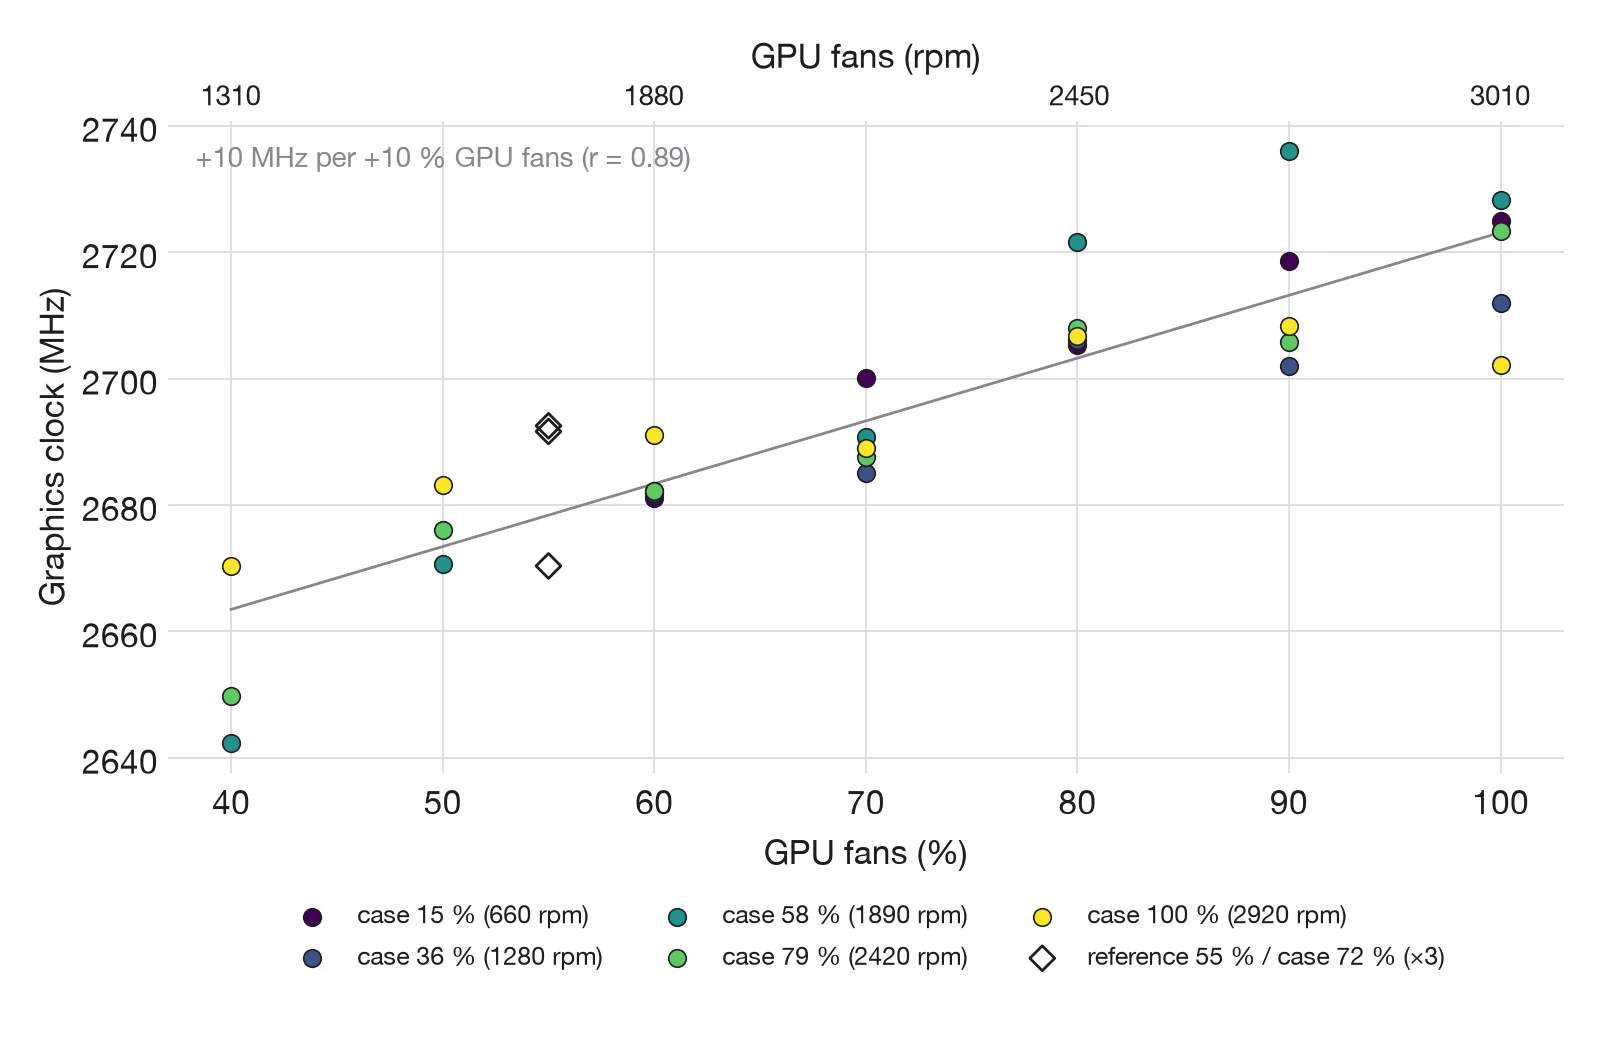
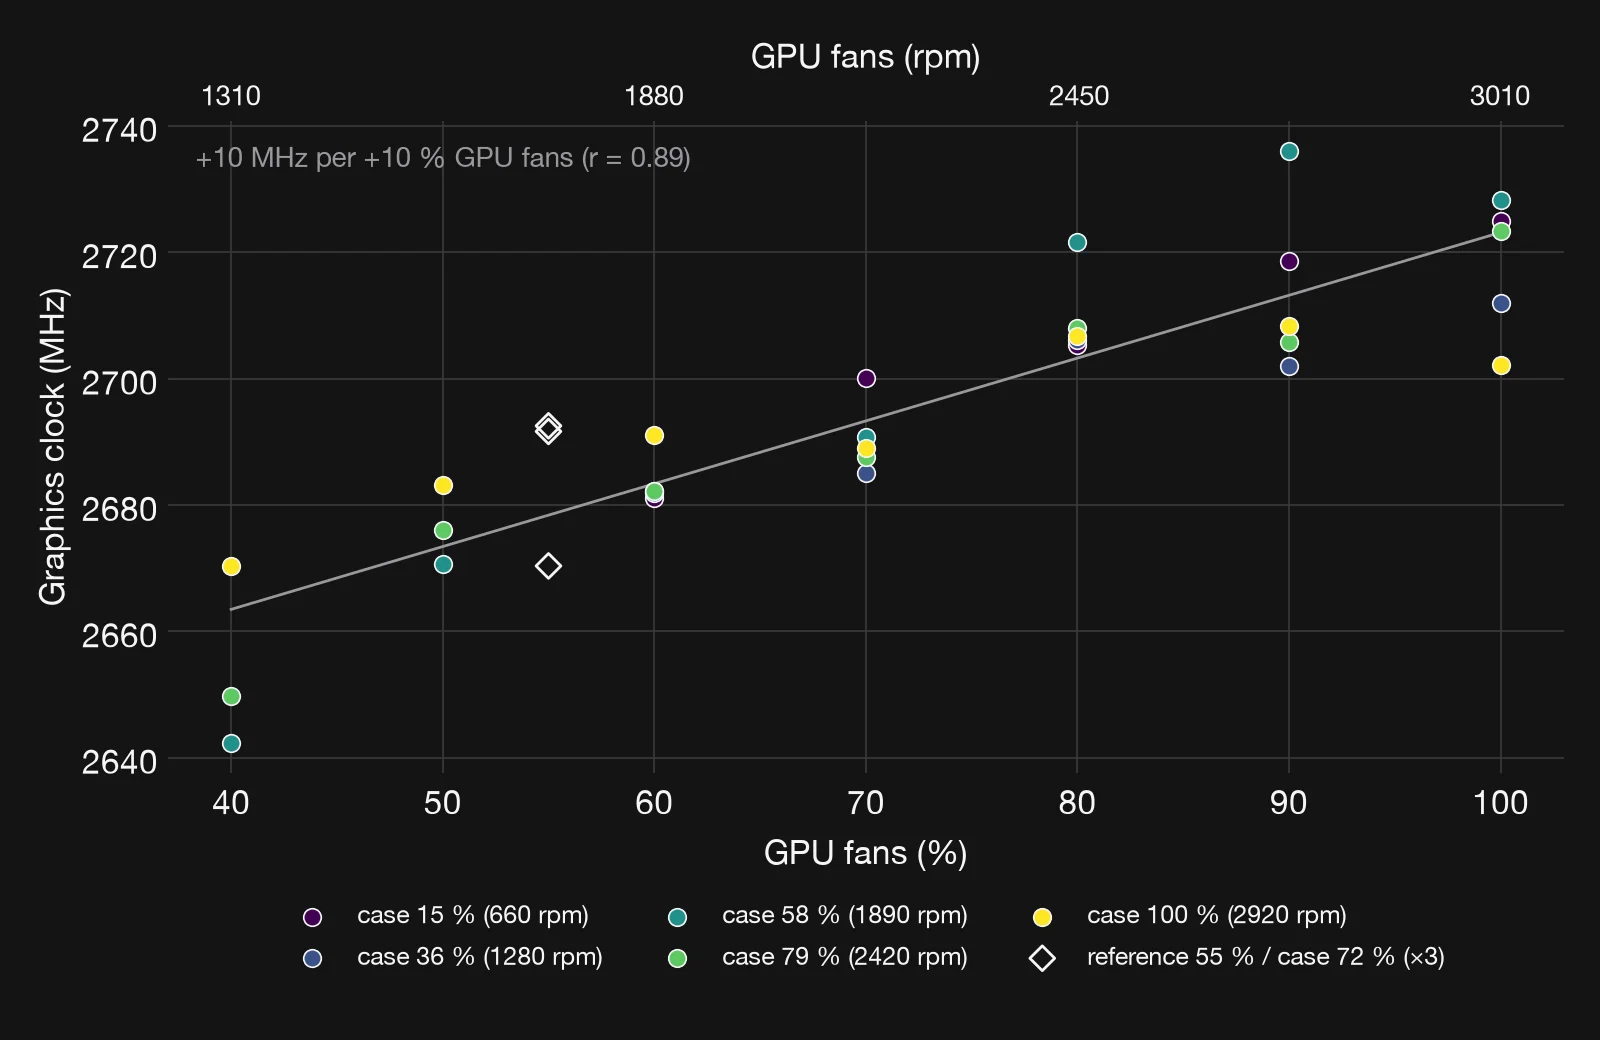
The memory clock read 14 001 MHz at every setting, so the memory never slowed down. The graphics clock ranged from 2642 to 2736 MHz over the 34 grid cells, 2695 MHz on average.
It fell slightly as the GPU fans slowed: from about 2700 to 2730 MHz at 100 % to about 2640 to 2670 MHz at 40 %, with a correlation of 0.89 to the fan setting. The card sat at its power limit in every second, so a hotter chip, which leaks more, gets less clock for the same 575 W: about 2 to 3 % less at the quietest settings. The reference cell varied by 22 MHz between its three repeats.
This is not thermal throttling: the core stayed below 75 °C, far from its 90 °C maximum, and the thermal throttle flags stayed clear in every cell.
Throughput did not follow the clock. It stayed between 48.4 and 48.7 TFLOPS, so a clock 2 to 3 % lower cost no measurable throughput with this load.
Is 60 seconds enough?
On the 30 grid cells with a well-defined fit, the median hot-spot time constant is 50 s. The middle half lies between 36 and 64 s. On all seven validation cells, the 60-second fit predicted the steady hot spot within 0.50 °C on average and 1.05 °C at most.
After a fan change the temperature closes the gap to its new settled value as . With s:
| Time after the change | Share of the change reached |
|---|---|
| 10 s | 18 % |
| 20 s | 33 % |
| 60 s | 70 % |
| 120 s | 91 % |
| 150 s | 95 % |
| 300 s | over 99 % |
A reading taken 10 to 20 seconds after a change therefore understates a step of 5 °C by 3 to 4 °C. In the pilot, full steady state took 150 to 350 seconds. Fitting equation (3) to 60 seconds of readings recovers the settled value without waiting that long.
The validation cells all had GPU fans at 55 or 70 %. The cells at 40 to 60 % have time constants up to 215 s and the largest extrapolation, and still need steady-state checks. Their 60-second means lie up to 5 °C below the fitted values.
Core and memory are reported in whole degrees, and a 60-second fit to a stepped signal is unreliable. Across the seven validation cells its error averaged 9.9 °C for the core and 8.6 °C for the memory. These two sensors need steady-state cells.
Repeatability
The reference cell sat at GPU fans 55 % and case fans 72 %. Its hot spot read 80.20, 80.48 and 80.46 °C at the start, middle and end of the run.
was 0.107 °C/W each time, and the core and memory read 70 and 78 °C all three times. Throughput stayed between 48.4 and 48.7 TFLOPS in every cell, so no measured setting cost speed at 575 W.
Between the two runs, the same setting at 575 W agreed within 1 °C with the case fans at 15 %, and differed by up to 4 °C at 100 %. Intake air and case fan speed matched; the cells differed in what came before them.
Fast 60-second cells reached from a warmer or a cooler state can differ by 3 to 4 °C. In the main run, where each step was small, the 60-second fits matched their settled values within 0.5 °C on average. The next run starts each power level with a settled cell.
Power limit
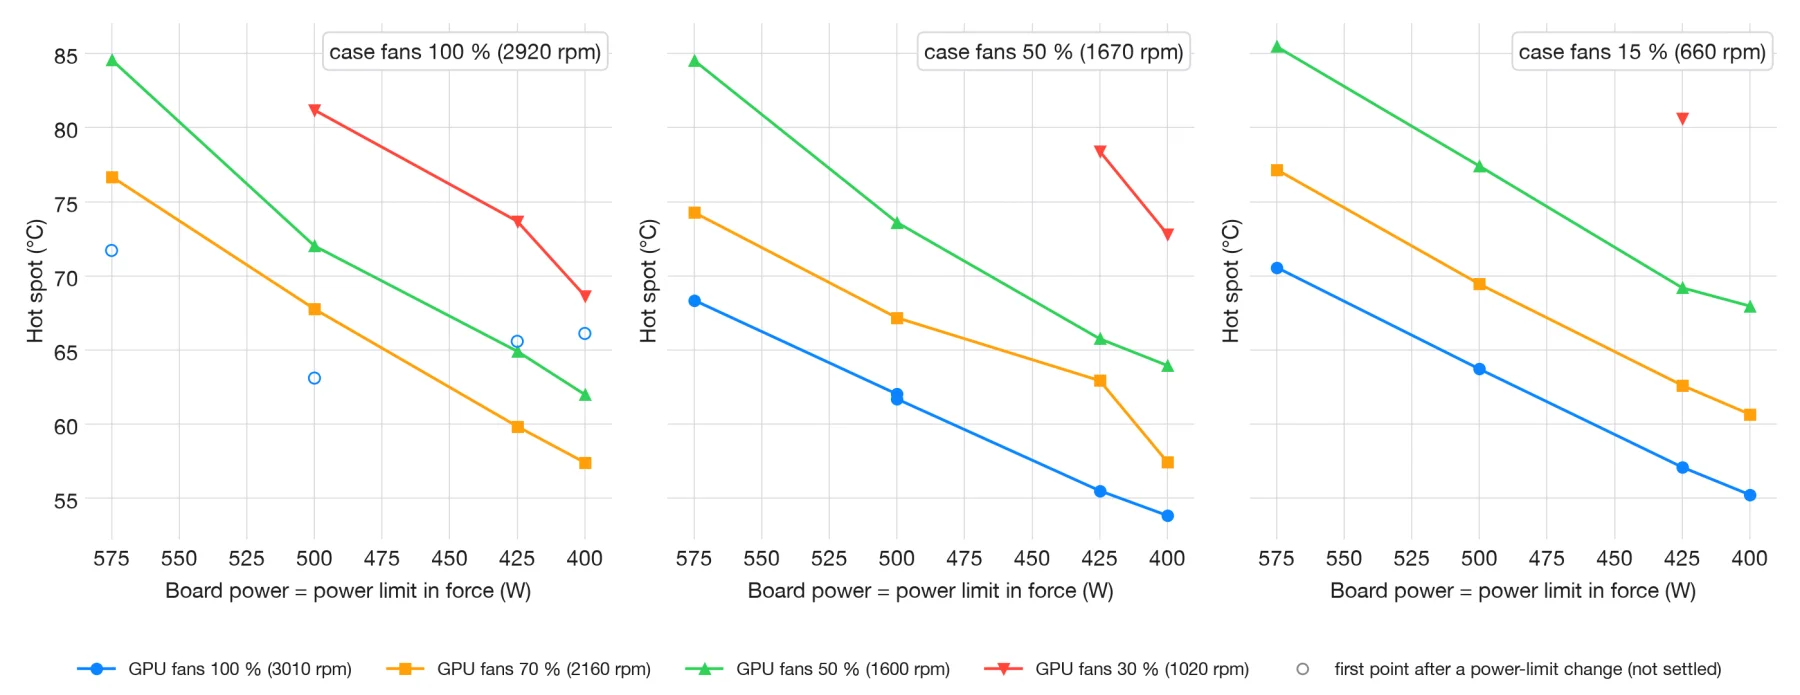
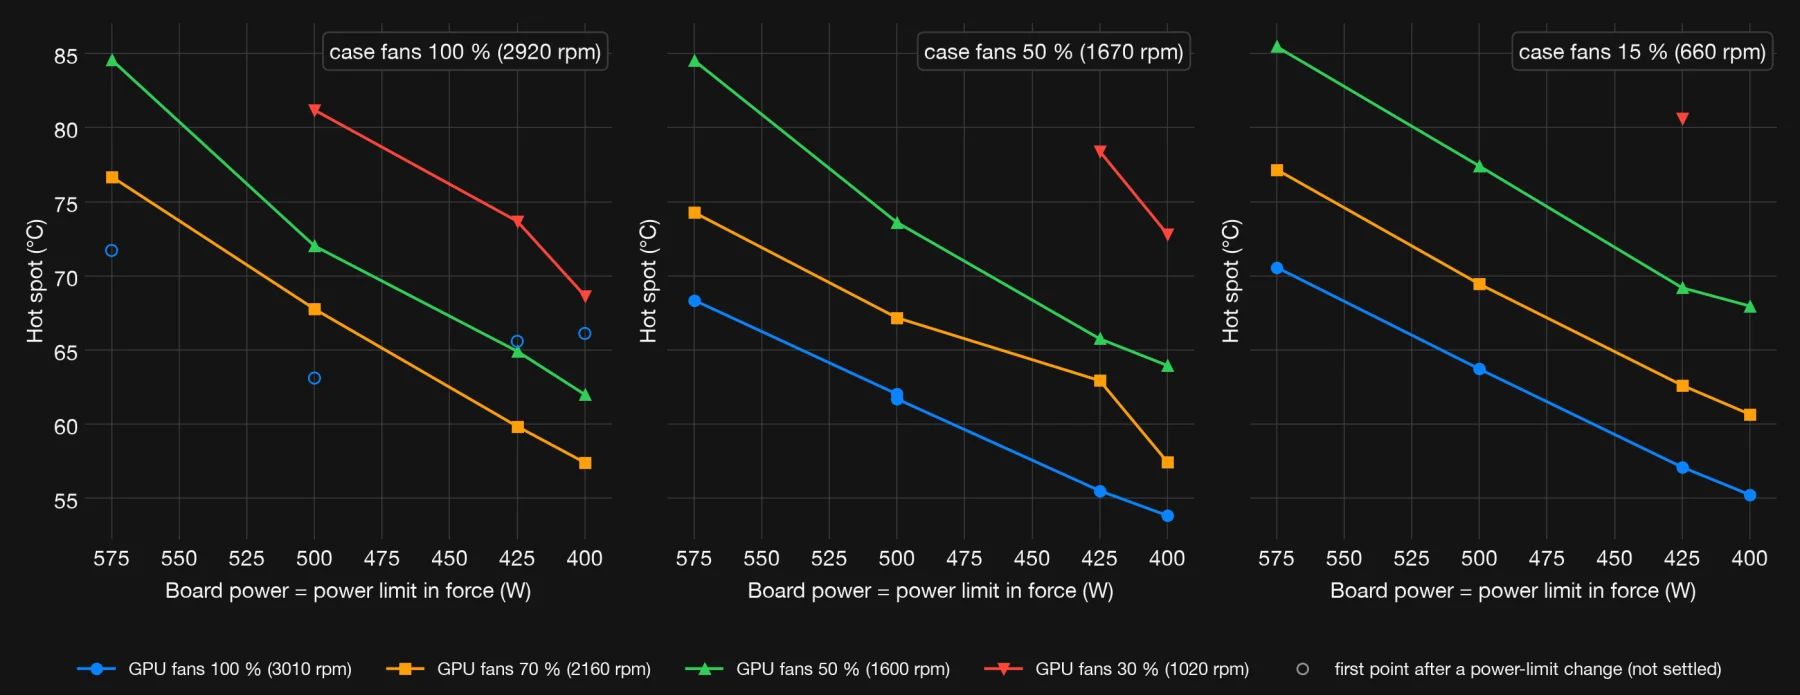
The power-limit run held the fans fixed and stepped the power limit down: 575, 500, 425 and 400 W. Of the 48 planned cells, 44 ran, and two of these stopped at a limit. The card accepts no limit below 400 W, 70 % of its stock limit.
At fixed fans, each 100 W less lowered the hot spot by about 8 to 13 °C. With case fans at 50 % and GPU fans at 70 %, it fell from 74.3 to 57.5 °C. In a quiet setting, case fans at 15 % and GPU fans at 50 %, it fell from 85.5 to 68.0 °C.
That slope is close to what equation (2) predicts: 100 W times an of about 0.1 °C/W.
The fan steps of this run were large, up to 30 points, so each fast cell may carry up to about 4 °C from the cell before. The slopes are approximate until the steady-state rerun.
GPU fans at 30 % were too hot at full power. They reached about 81 °C at 500 W with the case fans at 100 %, and 77 to 81 °C at 425 W with slower case fans. Except for one cell at 425 W, these cells had not fully settled after six minutes.
One of those slow cells, with a time constant of 125 s, settled: its 60-second fit was 1.3 °C high. In another, the last reading was already 1.2 °C above the fit.
With every fan at 100 %, the cell ran first after each change of power limit, straight after the hottest cell of the level before. The card was still cooling, so these values are shown as not settled and will be measured again. The cost in performance at each limit follows with the next data.
Quiet settings for a target temperature
Low temperature and low noise conflict. A setting is Pareto-optimal when no other setting is both cooler and quieter [14]. The set of such settings is the Pareto frontier.
We trace it with the ε-constraint method [14]. For a target temperature on each sensor , the quietest setting solves
Solving (9) for a range of targets traces the frontier. Each point on it is a pair of fan speeds, ready to use in a fan curve.
Noise from several fans adds on an energy basis:
The loudest fan dominates the sum. This is why the frontier can favour spreading the airflow over both sets of fans rather than running one set fast. The measurements show whether it does for a given card and case.
Power within a noise budget
Equation (2) also works the other way. Take a temperature limit for each sensor, a noise budget and the warmest intake air expected. The highest power the card can sustain is
One fan setting must keep every sensor below its limit, so the smallest margin is taken for each setting.
is never set above the card’s own power-limit range. The result is one power limit for each noise budget. We evaluate (11) for the test room and for the warmest days, so the limit still holds then.
The fan policy follows from this. Fans are raised first, along the frontier. Power is limited only once the noise ceiling is reached, for example when the case fans reach 2000 rpm.
The power-limit run
The power-limit run adds power as an axis. Four power limits, 575, 500, 425 and 400 W, are combined with four GPU fan levels and three case fan levels: 48 cells. The GPU fans run at 30, 50, 70 and 100 %, the case fans at the lowest speed, 50 and 100 %.
The card accepts no limit below 400 W, so a requested 350 W runs at 400 W. The power limit is the outer loop, from high to low, and the fan grid is planned in full at each limit; unsafe cells are skipped. Every cell uses the same 70-second method as the main grid.
Each cell also logs the work done: arithmetic throughput in TFLOPS and memory bandwidth in GB/s. This gives performance as a function of the power limit.
The run tests whether depends on , the assumption behind equation (1). With equation (2) and a limited , it shows what each step of quiet costs in speed.
Two cards in one case
With two cards, the exhaust of the upstream card warms the intake of the card downstream. If the temperature rise stays proportional to power, equation (2) extends by superposition to a coupling matrix:
and are each card’s own resistance. is how much the power of card 1 heats card 2, and the reverse. Every entry depends on the fan settings, so the grid now has three axes: , and .
We load one card at a time while the other idles; each run gives one column of the matrix. The idling card still draws a few tens of watts, and this enters as its . A run with both cards loaded checks that the sum predicts the combined temperatures.
Acting before the temperature rises
A fan controller that waits for the temperature of card 2 reacts late. The heat sink stores heat, so its temperature lags a step in power by minutes. The power of card 1 is known at once, so the controller can act on it first [15]:
The fans of card 2 follow the predicted temperature , and feedback on the measured temperature corrects what the model misses. Results for two GeForce RTX 5090 cards follow once the second card is fitted.
Limits of the method
- Results hold for the card, case, fans, load and room that were measured. Another case or fan layout needs a new grid.
- The temperature rise is assumed proportional to power, so does not depend on . The power-limit run checks this; it is not taken on trust.
- Sensors differ between cards. Where a card lacks a sensor, its limit falls to the others.
- Dust and fan wear change over months. Re-measuring a few cells shows the drift.
- Noise is measured at one position. The room changes what a person at the desk hears.
- If a run has no sound level meter, each set of fans is given a rated level at a reference speed. That level is scaled by 50 log10 of the speed ratio, a fan law [3], and the sets are summed with equation (10).
Sources
- NVIDIA. GeForce RTX 5090 specifications. nvidia.com
- ISO 7779:2018. Acoustics — Measurement of airborne noise emitted by information technology and telecommunications equipment. International Organization for Standardization.
- ASHRAE. ASHRAE Handbook — HVAC Systems and Equipment, chapter 21, ‘Fans’. ASHRAE, Atlanta, 2020.
- JEDEC. JESD51-12, Guidelines for Reporting and Using Electronic Package Thermal Information. JEDEC Solid State Technology Association, 2005.
- A. D. Kraus, A. Bar-Cohen. Thermal Analysis and Control of Electronic Equipment. Hemisphere / McGraw-Hill, New York, 1983.
- G. E. P. Box, J. S. Hunter, W. G. Hunter. Statistics for Experimenters, 2nd ed. Wiley, Hoboken, 2005.
- F. W. Dittus, L. M. K. Boelter. Heat transfer in automobile radiators of the tubular type. University of California Publications in Engineering 2 (1930) 443–461.
- W. H. McAdams. Heat Transmission, 2nd ed. McGraw-Hill, New York, 1942.
- R. H. S. Winterton. Where did the Dittus and Boelter equation come from? International Journal of Heat and Mass Transfer 41 (1998) 809–810.
- T. L. Bergman, A. S. Lavine, F. P. Incropera, D. P. DeWitt. Fundamentals of Heat and Mass Transfer, 7th ed. Wiley, Hoboken, 2011.
- G. A. F. Seber, C. J. Wild. Nonlinear Regression. Wiley, New York, 1989.
- M. Stone. Cross-validatory choice and assessment of statistical predictions. Journal of the Royal Statistical Society B 36 (1974) 111–147.
- JCGM 100:2008. Evaluation of measurement data — Guide to the expression of uncertainty in measurement. Joint Committee for Guides in Metrology, 2008.
- K. Miettinen. Nonlinear Multiobjective Optimization. Kluwer Academic Publishers, Boston, 1999.
- K. J. Åström, R. M. Murray. Feedback Systems: An Introduction for Scientists and Engineers. Princeton University Press, 2008.
A method developed by WS.COMPUTER / GRUENCY. © WS.COMPUTER 2026. Questions about the method, or a measurement for your own system: info@gruency.com